echarts 4 柱状堆叠图溢出的原因与解决办法
- 前端开发
- 2022-12-28
- 1931热度
- 0评论
echarts 的柱状图类型,配置了 stack 项时,可以实现为柱状堆叠图的效果。近期在某个使用 echarts 4 的项目中,测试同学反馈出现了溢出现象,即部分数据不可见。下图是在官方示例中进行的还原,可以看到第一列的最后一个数据 100 因为溢出而不可见:

经过观察其表现分析可以初步看出,由于设置了 barMinHeight 参数,当存在较多的小数据值时,该设置会导致堆叠图有较大部分的空间预留给她们,剩下的部分则需要按比例计算,但是这个计算是自适应的,不会考虑 barMinHeight 的情况。
我们可以简单的理解为,用于展示 barMinHeight 的空间,是来自于 boundaryGap(默认值为 ['20%', '20%']) 预留的多余空间长度,当该空间长度不足以显示 barMinHeight 时,即会出现溢出现象。
解决的方法则可以是在拿到数据后,根据实际的数据计算一个合适的 boundaryGap 取值,只要预留的长度足够显示全部 barMinHeight 的占位长度即可。不过该参数不能与 legend 图例联动,效果并不太好。还有一种办法是设置 xAxis.max 参数,由于它可以写为函数参数动态计算,可以较好的适配响应式交互。相关代码参考:
var domWidth = dom.clientWidth;
option.xAxis.max = value => {
  let max = value.max;

  max = (max / (domWidth - option.series.length * 60)) * domWidth;
  const x = max > 100 ? 100 : 10;
  return Math.floor(max / x) * x;
};
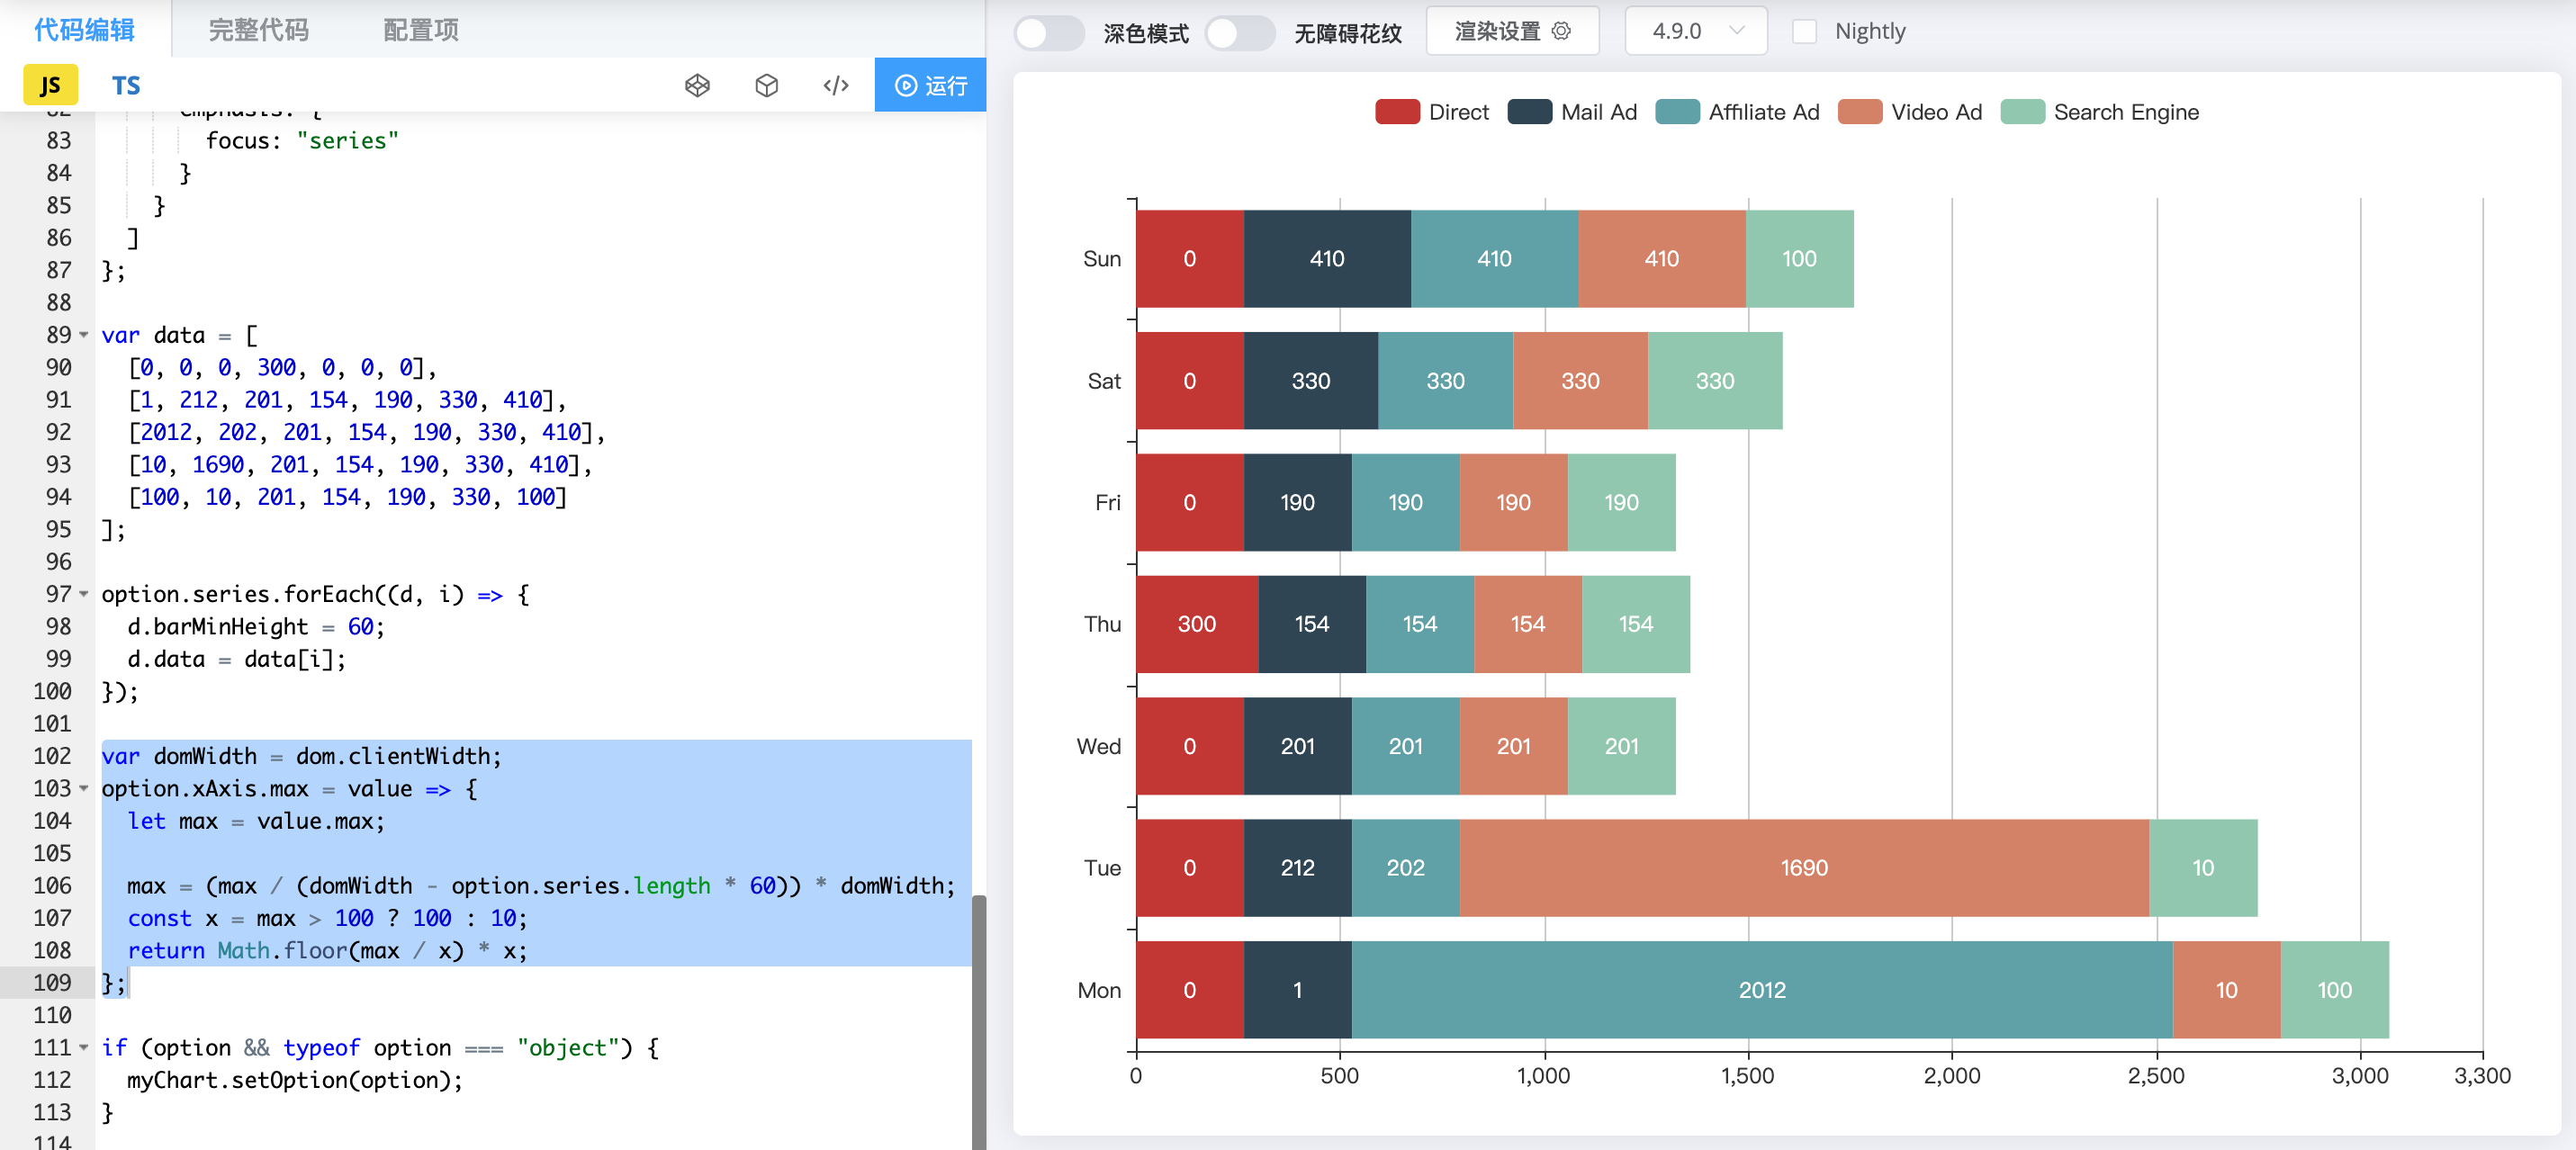
可以看到被溢出隐藏的100已经可以较好的显示出来了。以下为完整的示例代码:
var dom = document.getElementById("chart-container");
var myChart = echarts.init(dom, "dark", {
  renderer: "canvas",
  useDirtyRect: false
});
var option;

option = {
  tooltip: {
    trigger: "axis",
    axisPointer: {
      type: "shadow"
    }
  },
  legend: {},
  grid: {
    left: "3%",
    right: "4%",
    bottom: "3%",
    containLabel: true
  },
  xAxis: {
    type: "value"
  },
  yAxis: {
    type: "category",
    data: ["Mon", "Tue", "Wed", "Thu", "Fri", "Sat", "Sun"]
  },
  series: [
    {
      name: "Direct",
      type: "bar",
      stack: "total",
      label: {
        show: true
      },
      emphasis: {
        focus: "series"
      }
    },
    {
      name: "Mail Ad",
      type: "bar",
      stack: "total",
      label: {
        show: true
      },
      emphasis: {
        focus: "series"
      }
    },
    {
      name: "Affiliate Ad",
      type: "bar",
      stack: "total",
      label: {
        show: true
      },
      emphasis: {
        focus: "series"
      }
    },
    {
      name: "Video Ad",
      type: "bar",
      stack: "total",
      label: {
        show: true
      },
      emphasis: {
        focus: "series"
      }
    },
    {
      name: "Search Engine",
      type: "bar",
      stack: "total",
      label: {
        show: true
      },
      emphasis: {
        focus: "series"
      }
    }
  ]
};

var data = [
  [0, 0, 0, 300, 0, 0, 0],
  [1, 212, 201, 154, 190, 330, 410],
  [2012, 202, 201, 154, 190, 330, 410],
  [10, 1690, 201, 154, 190, 330, 410],
  [100, 10, 201, 154, 190, 330, 100]
];

option.series.forEach((d, i) => {
  d.barMinHeight = 60;
  d.data = data[i];
});

var domWidth = dom.clientWidth;
option.xAxis.max = value => {
  let max = value.max;

  max = (max / (domWidth - option.series.length * 60)) * domWidth;
  const x = max > 100 ? 100 : 10;
  return Math.floor(max / x) * x;
};

if (option && typeof option === "object") {
  myChart.setOption(option);
}

window.addEventListener("resize", myChart.resize);
以上为 echarts4 中的表现,echarts5 会是怎样的呢?可以复制上面的代码到官方示例中测试分析一下。实际上 echarts 5 对于堆叠图的计算逻辑发生了较大的变化,尽量不要设置 barMinHeight 参数。
echarts5柱状堆叠图示例:https://echarts.apache.org/examples/zh/editor.html?c=bar-y-category-stack&version=5.4.1

